Results 1 to 3 of 3

Thread: Plotting locations on Matlab 3D sphere

Hybrid View

Previous Post Previous Post   Next Post Next Post
  1. #1

    Default Plotting locations on Matlab 3D sphere

    Well, I've a 250x3 matrix containing some geographic coordinates locations, where the first column represents the latitude (-90 to 90), the second one longitude (-180 to 180), and the third one is just the radius (for now, I'm not considering altitude, so it's the same value for all).

    I've tried creating a sphere, but I can't see how to plot the points on it. I've also just tried by plotting using sph2cart (for using this I made all latitudes and longitudes positive and running between 0 and 360) and then plot3. This option gives me a "sphere of points" with the correct radius, but wrong locations. Is possible to do this on Matlab?

    The code looks like this:

    superdat; % This is the 250x3 matrix of coordinates
    [datacbo datacba datacz]=sph2cart(superdat(:,1)*(pi/180),superdat(:,2)*(pi/180),superdat(:,3));
    plot3(datacbo,datacba,datacz,'*')

    Extra: a plot of the coordinates in 2D-Equirectangular projection

    Ili_Thar_-180_180.jpg
    Last edited by Tharsoum; 11-01-2013 at 09:28 PM.

  2. #2
    Software Dev/Rep Hai-Etlik's Avatar
    Join Date
    May 2009
    Location
    48° 28′ N 123° 8′ W
    Posts
    1,333
    Blog Entries
    1

    Default

    Elevation is measured relative to one of the poles, not to the equator. You probably need to add a quarter turn to all your latitudes to get elevations.

  3. #3
    Guild Expert johnvanvliet's Avatar
    Join Date
    Jul 2012
    Location
    N 42.39 W 83.44
    Posts
    1,091
    Blog Entries
    4

    Default

    an old post but this is easy to do in Blender
    a normal everyday CSV file nasa/jpl uses these a LOT
    take for example Jupiters moon Amalthea (j5amalthea.tab)
    from :
    EAR_A_5_DDR_STOOKE_SHAPE_MODELS_V1_0
    h t t p : / / sbn.psi.edu/pds/asteroid/EAR_A_5_DDR_STOOKE_SHAPE_MODELS_V1_0/data

    j5amalthea.tab
    has 2700 lines in this format -- first 10 lines
    Code:
        0  -90     53.000000
        0  -85     56.033870
        0  -80     60.277550
        0  -75     63.620630
        0  -70     67.513030
        0  -65     71.267010
        0  -60     74.758350
        0  -55     76.839240
        0  -50     81.041340
        0  -45     83.871950
    Longitude , latitude , and Radii in Kilometers
    now you can just convert this to a flat plain very easy
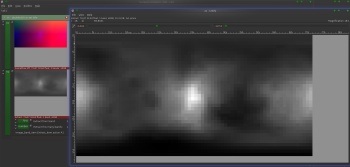
    it is a 3 band CSV ascii raw file 72 x 37 pixels ( 37 for the odd single pix at the north and south pols )
    i use ISIS3 but any program that handles csv files will do
    -- Even EXCEL or OO's Calc or lotus 123
    a screenshot in Nip2
    there is a blender plugin for importing the nasa /jpl PDS dem's
    -- see the blenderartists forum and the blended plugin pages
    Extensions:2.6/Py/Scripts/Import-Export/NASA IMG Importer - BlenderWiki
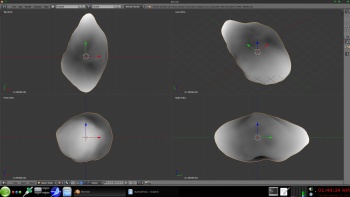
    it opens like this in Blender

Posting Permissions

  • You may not post new threads
  • You may not post replies
  • You may not post attachments
  • You may not edit your posts
  •