Page 5 of 61 FirstFirst 1234567891555 ... LastLast
Results 41 to 50 of 608

Thread: The Köppen–Geiger climate classification made simpler (I hope so)

  1. #41

    Default

    Ah, okay! Looking forward to the full version!

  2. #42
    Guild Grand Master Azélor's Avatar
    Join Date
    Jul 2008
    Location
    Québec
    Posts
    3,363

    Default

    Some details, some are more evident than other but might still be educative:

    windjan.jpg
    windjul.jpg


    Rossby wave. While not unique to America, it have a unique characteristic one this continent as explained in this article : http://www.americanscientist.org/iss...mild-climate/3


    The Arctic is cold and trapped in ice with low evaporation. A high albedo: reflect a lot of energy to space instead of absorbing. This result in low humidity.

    In summer:

    One things I haven't really figured out is where the influence of the front ends. I believe that it extends farther south that it's counterpart in Europe, but I don't know where it ends.
    America is large enough to create his own modest monsoon. Mexico can be pretty rainy. There is the altitude but there is also a low pressure system around. It's not the ITCZ but possibly and extension of it? Anyway, all of central America is really wet.


    July: during the cold season, the coasts receive some rain but it's not much and it's mostly if they are at right angle with the winds coming from the sea. The rest is dry except for the ITZC. Again, the rain belt is mostly a straight line. The Horn is still dry because it receive winds from the interior of the continent blowing toward Arabia...


    South America:

    January: A lot of things are still obscure about this continent. It receive more rain than Africa. Larger landmasses tend to become hotter and become larger low pressure center. This and apparently, the Amazon forest generates 50-80% of it's the region's precipitations. I've found this data on Earth Stackexchange but, I'm not sure the source is good. The forest must help keeping the place more humid but maybe the influence is smaller.

    The reason why there is a larger forested area in SA compared to Africa is probably because the variation of the ITCZ is smaller than in Africa, the center of the continent seems closer to the equator. Just some theories.

    Aside from that, Eastern Brazil is drier because it receive drier air from the high pressure system. That relation is inversed in winter but I'll talk about it later.
    Last edited by Azélor; 10-07-2015 at 04:26 PM.

  3. #43

    Default

    Interesting.

    Is this to be part of the guide, or just ancillary information?

  4. #44
    Guild Grand Master Azélor's Avatar
    Join Date
    Jul 2008
    Location
    Québec
    Posts
    3,363

    Default

    Quote Originally Posted by Mysterious Mapmaker XXIII View Post
    Interesting.

    Is this to be part of the guide, or just ancillary information?
    I don't know yet.


    I might have figured something out. Basically, we can estimate the quantity of rain mostly based on the air pressure and direction of the winds. And with a combination of other factors such as the distance from the water bodies.

  5. #45
    Guild Grand Master Azélor's Avatar
    Join Date
    Jul 2008
    Location
    Québec
    Posts
    3,363

    Default

    Step 1 basic elevation map
    The first step is to make the elevation map. I made one level of elevation for each 1000m above sea level.
    I added several others layers of elevation under 1000m but they are mostly aesthetical.

    And by the way, it will also help a lot if you have latitude/longitude lines since we will refer to them all the time.

    Attachment 75636

    Attachment 79116


    Step 2 oceanic circulation, surface currents:


    Reference maps:

    A simple one:
    0908B.jpg

    And another, more detailed: https://upload.wikimedia.org/wikiped...erless%293.png

    Color signification:


    • · Blue: Polar currents are cold between the poles and the polar circle. Currents flowing toward the equator are cold if they originate from these regions.
    • · Red: Equatorial currents are hot, including those flowing from the equator toward the poles.
    • · White: Mid latitudes currents are mild. Hot current flowing poleward eventually get mild. And cold current become mild when they get closer to the equator. Mild currents also happen when cold and hot water are mixed.


    Close to the equator, you can omit the transition to mild because at this latitude, water temperature has little impact unless it’s very cold.


    Mapping the currents:

    1. Close to the equator there are two currents flowing westwards.

    2. As these two currents meet a large landmass they diverge away from the equator, toward the poles.
    They will stick to the eastern coast of that continent approximately until 40ş to 45ş of latitude. They are hot: draw them in red.

    3. At about 45ş, the Westerlies (West -> East winds) are strong enough to create an eastward current. It gradually shift direction toward the east.
    As it cross the ocean it can sometimes be tilted a little toward the north east. Draw in red and use white if the current drifts far enough from the continent.

    4. When this current meets continental shores, it spreads north and south following the coasts.
    The currents moving back to equator will get slowly warmer. The part that flows north continues to cool slowly.


    5. Poles: If you have polar oceans, you need to close the loops.
    Cold current flowing back to mid latitudes tends to stick to the coast until they encounter the hot currents mentioned at point 2.
    They fill the void left by the north-eastward movement of this hot current and then turn abruptly to the east. In the current map: see the Labrador Current east of New England.


    Near the poles, the currents are flowing from the east to the west. This only happens at very high latitudes (over 70 degrees approximately), where the polar easterlies are the dominant winds.

    oceanic currents new.png


    Step 3 : Atmospheric pressure systems


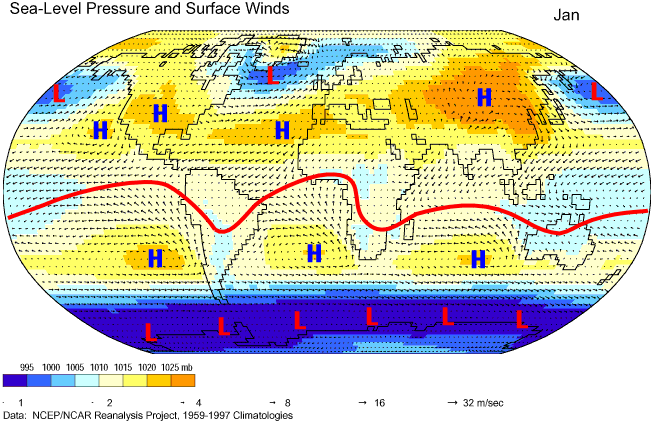
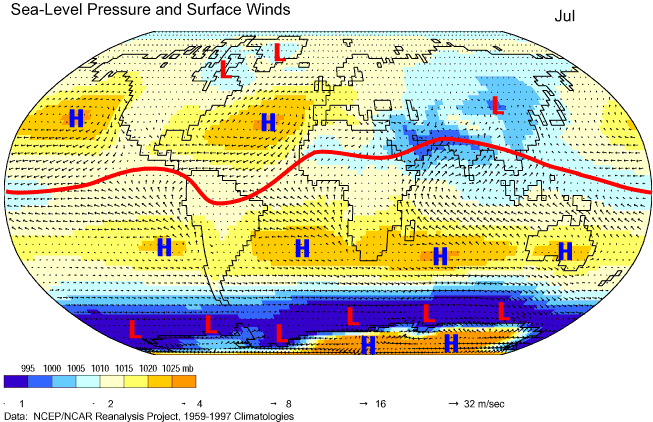
    The hottest place is near the equator. It’s the Intertropical convergence zone, ITCZ for short. The air rises.
    The poles are the coldest, and the cold air sinks.

    The position of the pressure systems changes over the course of the year, with the ITCZ roughly located where the planet receive the most energy from the star. It should be close to the tropic n the summer but the position is influenced by the actual temperatures. Land heat up more than water and large landmasses will pull it to them. This mechanism is the main engine of the atmospheric circulation.

    Look here for a detailed explanation of atmospheric circulation: https://en.wikipedia.org/wiki/Atmospheric_circulation


    The ITCZ, a low pressure system


    Close to 10-15° normally. During the summer, the movement of the ITCZ is strong in Asia but limited elsewhere. In order to have an impact, continents need to be large, hot, with significant landmasses around the tropics.
    The position of the ITCZ is not always clearly defined. The Intertropical latitudes are always hot and therefore, there is a consistent low pressure system.


    A. High pressure center


    Oversea:

    Cold season: 30° in a more or less continuous line
    Hot season 35° separated, mostly on the eastern side of the oceans

    Tend to be located on the eastern side, close to the continents because it’s where the cold currents are flowing.
    In summer, the high pressure system breaks apart as the continents are affected by low pressure systems due to hotter temperatures.

    Inland:
    Cold season: high pressure systems develop over the continents (including the poles). Larger continent = higher pressure.
    Hot season: hot temperatures prevent the formation of high pressure systems.

    The inland systems tends to be poleward of the high pressure systems that are over the ocean.
    Areas between the tropics are not cold enough to become high pressure but it does not mean that the pressure is low.


    B. Low pressure systems:


    Oversea:
    Cold season: Centered around 55°
    Hot season: Move 5 to 10° closer to the poles

    They tend to disappear over the land.

    Inland:
    Cold season: No low pressure overland.
    Hot season: large landmasses become hot and the low pressure can cover most of the continent.


    January

    jan pressure.jpg

    July

    jul pressure.jpg
    Attached Images Attached Images
    Last edited by Azélor; 07-01-2017 at 03:03 PM.

  6. #46
    Guild Artisan Pixie's Avatar
    Join Date
    Jan 2014
    Location
    Lisbon
    Posts
    939

    Default

    Right on, Azelor! There are valuable additions to the method and wording so far. I'm certain this will turn out (finally) to be a self standing complete tutorial.

    ... And there's a good chance it will become a sort of Geoff's Cookbook 2.0 over the internet

  7. #47
    Guild Grand Master Azélor's Avatar
    Join Date
    Jul 2008
    Location
    Québec
    Posts
    3,363

    Default

    Step 4, winds:

    Use the pictures to figure out how the winds are blowing. Figure A
    Or use the main map at the bottom at the page.
    All the figures are from the North Hemisphere except E.

    climate-graphics.jpg


    Dominant winds


    • Near the equator, the dominant winds are usually blowing to the west (Trade Winds)
    • In mid latitudes, it’s blowing to the east (Westerlies)
    • And close to the poles they are blowing to the west again (Polar Easterlies)


    Wind usually flow from the highest pressure to the lowest. The larger the difference in pressure between two areas, the stronger the winds will be.
    Inside a large high or low pressure zone, the winds can be very weak. Figure B

    Mid latitudes winds: Starting with your low pressure bands at high latitudes, the Westerlies should blow from west to east where it’s blue, and where there are no colors. Avoid the red.

    Low pressure have 2 types:
    • Hot season: converge like the ITCZ in Asia, see figure F
    • And those of the mid and high latitudes, the North Pacific (round , isolated) and the North Atlantic (continuous band of low pressure) Figure G

    The high pressure systems at mid latitudes (also called subtropical highs):
    • Draw the poleward winds first. They have a curved shaped because they quickly change direction when encountering the Westerlies. Figure C
    • Winds blowing from the equatorward side of the system tend to blow toward the equator, or if any, toward the closest low pressure center.
    Winds are converging near the equator; they tend to blow to the west. Figure D

    Polar highs: The high pressure systems on the poles brings dry and extremely cold temperatures. Figure E (South Pole)

    Overland highs are spinning according to the schema. See Figure A, or look at Eastern Asia in winter.

    January winds

    jan winds.jpg

    July winds

    jul winds.jpg


    Last edited by Azélor; 07-01-2017 at 12:36 PM.

  8. #48
    Guild Adept groovey's Avatar
    Join Date
    Apr 2014
    Location
    Spain
    Posts
    256

    Default

    Excellent! I guess it's time I get my height-map ready...again. Will let you know when I'm ready to start trying these steps.

    EDIT TO AVOID DOUBLE POST:

    Hi Azelor.

    I've started running your revised tutorial. I'm quite confused at "Step 3 : Atmospheric pressure systems":

    For example, at:

    "B. Low pressure systems:

    Overland:
    Cold season: No low pressure overland."

    Bu then, in the January map you do paint low pressure (blue) on land.

    By the way, I didn't catch anywhere that altitude has much of an influence, so I wonder if these old preassure maps you made long ago are still valid?
    Last edited by groovey; 10-13-2015 at 01:14 PM.

  9. #49
    Guild Grand Master Azélor's Avatar
    Join Date
    Jul 2008
    Location
    Québec
    Posts
    3,363

    Default

    Sorry, I just noticed this message of yours.

    No, I haven't painted blue overland during the cold season. Unless you meant the southern tip of Greenland. It's blue but just because it's surrounded by water and by the low pressure system nearby. Coastal locations can be blue for this reason. But not inland, because the low temperatures are not prone to a low pressure system.

    Other than that, I'm gonna say this because maybe it was not obvious: The cold season refer to January in the north but to July in the south. That's why South America is all blue in January
    I thought that using cold/hot season was better than using winter/summer since some places have only 1 or 2 seasons but everywhere has a coldest/hottest month around either January or July. (Almost everywhere)

    And no, i don't think your pressure maps are still good.

  10. #50
    Guild Adept groovey's Avatar
    Join Date
    Apr 2014
    Location
    Spain
    Posts
    256

    Default

    D'oh! *massive facepalm*.

    I forgot to consider cold/hot seasons are opposite in the hemispheres. Now it makes much more sense.

    Since your tutorial is bound to stick around as reference for future projects of this kind, you might consider adding the reminder in the step. I'd bet I might not be the only one on the long run who completely forgets about that important detail...

Page 5 of 61 FirstFirst 1234567891555 ... LastLast

Tags for this Thread

Posting Permissions

  • You may not post new threads
  • You may not post replies
  • You may not post attachments
  • You may not edit your posts
  •